 At the end of each web development project, I give each client an hour training session in WordPress. If time allows, I jump over to Google Analytics and show them some of the available reports and data I use for our company.
Most clients are completely new to Google Analytics or if they do own an account, they’ve forgotten all about it.
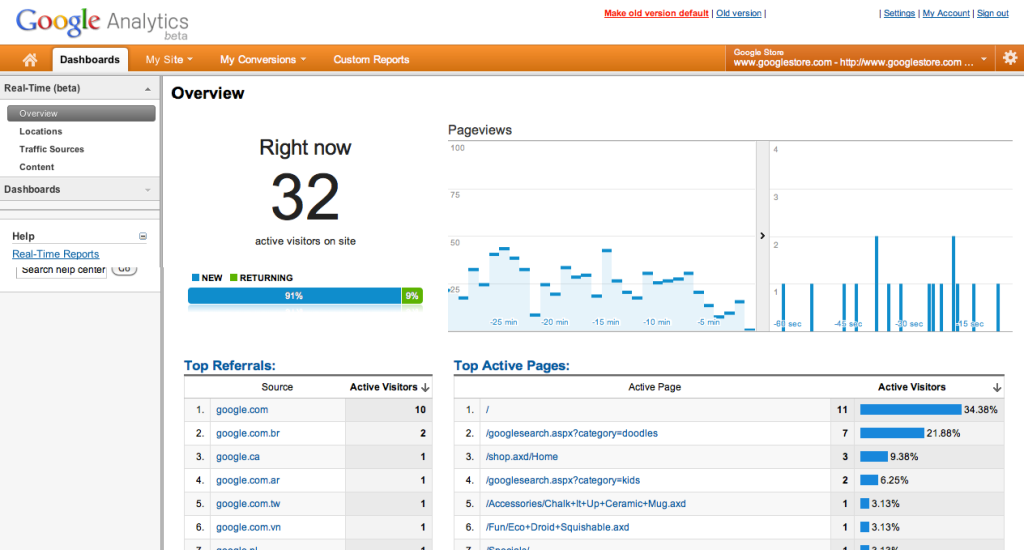
While our clients oh and ah over data like visits, traffic sources, and keyword tracking, the best and funniest responses come from a quick jump into Google Analytics Real-Time reporting data. People are amazed at the free data available.
Available Data in Google Analytics Real-Time Data
There is a lot of good stuff available in this area of Analytics. In March of 2013 Google added some beta features to increase the reporting even further. Current real-time data features include:
- Visitors currently on your website
- Geographical locations of these visitors
- Source of these visitors (i.e. search engine, social media website, direct)
- Keywords used by these visitors
- Current content being viewed by these visitors
- Percentage of new versus returning visitors
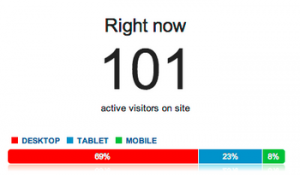
- Percentage of desktop versus mobile visitors
- In Beta: Events (such as product purchases)
- In Beta: Conversions (such as contact form submissions)
That is a whole lot of analytics shown to you in real-time movement. And by real-time, I mean you can sit and just watch the data change second to second.
As I was typing this blog post I watched someone come onto our website, view products, hang out in the store’s checkout, and finally purchase our theme developer license. I knew there was a purchase well before the notification email showed up or my PayPal app chirped.
The Trouble With Real-Time Data
There is one huge issue with the real-time data. I’ve discovered it myself and so have other people I know. It is a bit captivating and addictive. You need to enter into this data and view it with caution.
What happens is it sucks you in like a giant vacuum. Before you know it, you’re just sitting there watching users come and go and move around inside your website. You start watching the big orange dots on the map to see where your visitors are located and you start to drill-down into geographical segments to see minute details like the visitor’s city.
Do I really need to see this data? For the most part no. If you just launched a campaign or an incredibly witty tweet, maybe. Otherwise, not so much.
The Take Away
Google Anlaytics has an arsenal of great data that is just waiting for you to explore. Using the data wisely can help improve your marketing efforts and improve your bottom line. But remember, using real-time analytics is a great tool for some situations but not all situations.
Know the risk and be cautious of the horrendous time suck it produces.

Hi Rebecca
“If you just launched a campaign or an incredibly witty tweet, maybe.”
I use it for just that – send out a tweet and watch the reaction.
32 visitors is pretty impressive, never had that many.
That image was actually from Google. If you click the images, they will take you to Google articles.
I have anywhere from 2-20 on my website at a given time.
I find myself just wondering into the data while in Analytics and then I lost 20 minutes without realizing it. I said it was a vacuum, but I should have said it was a huge black hole!
Would love to hear the most important areas in Google Analytics that you share with your clients. I find most get overwhelmed with it very quickly.
Thanks!
Theresa 😎
I focus them on visits, traffic sources, referrals, organic keywords, bounce rate, and top content. After that they tend to go into data overload.
I’ll also set up a standard dashboard for them that I use and that gives them a starting point of data to review.
OK I just found your post and experience much the same thing with my clients. It gets doubly addicting when one sets the “bait” for visitors with real-time social media posts. Google Analytics is an amazing tool, and I can manage my interactions with the top line data (related to total visits, referrals, conversions, traffic trends, etc.) but the real time stuff is truly addicting!
The “bait” is funny! I hadn’t thought about doing that since just watching regular dots captivates me. That would make it even worse, although it would be a very very fun experiment and a blog post all on it’s own.